
As a Multi Academy Trust (MAT) leader or Trustee, you desire consistent data reporting that will provide you with an accurate picture of your Trust and schools. For example, assessment data might be collected in different ways across each of the schools in the Trust, but as a decision maker how do you gain the oversight that breaks down the barriers of different age phases, assessment approaches and terminologies? Read on to find out how we can answer this kind of question.
By having an accurate picture, you are better placed to make strategic and timely decisions that will have a positive outcome on the overall performance of your Trust.
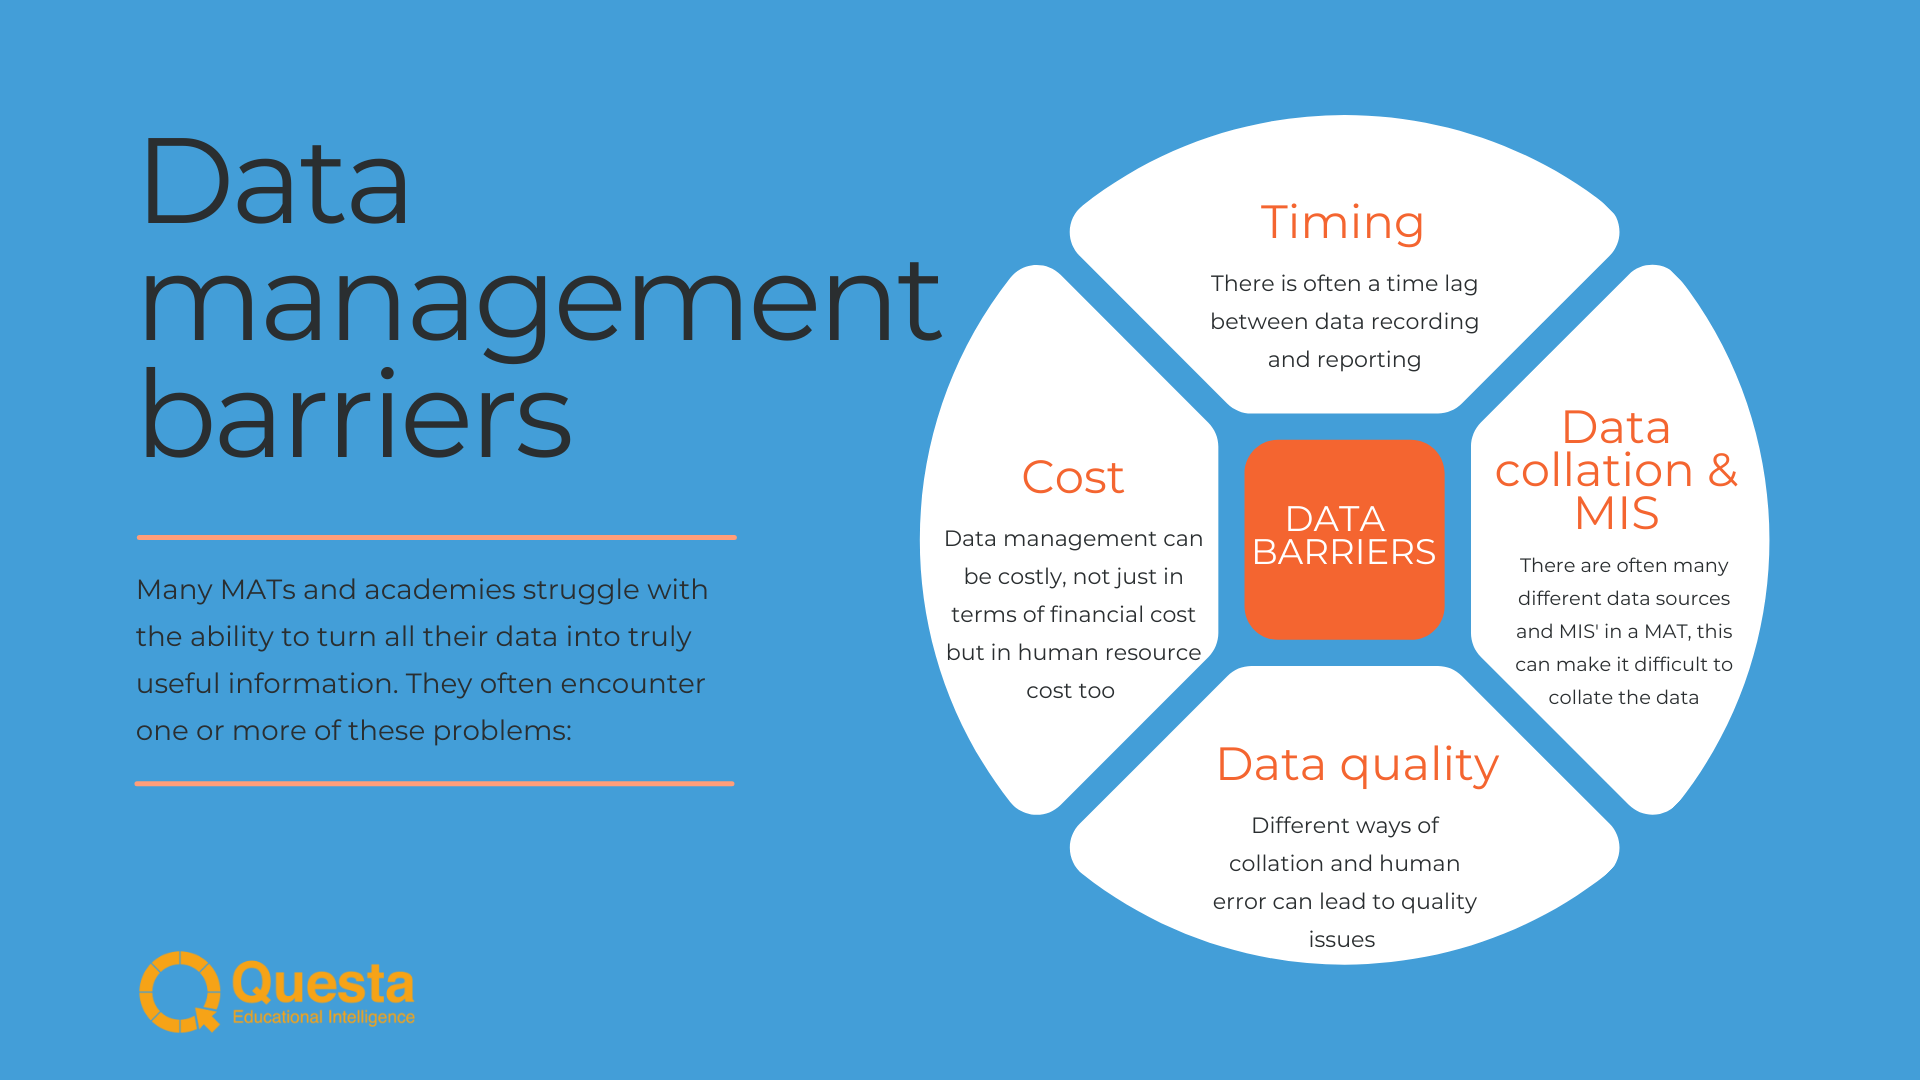
You know that the data exists, yet you face all or some of the many barriers that we see MATs trying to overcome:
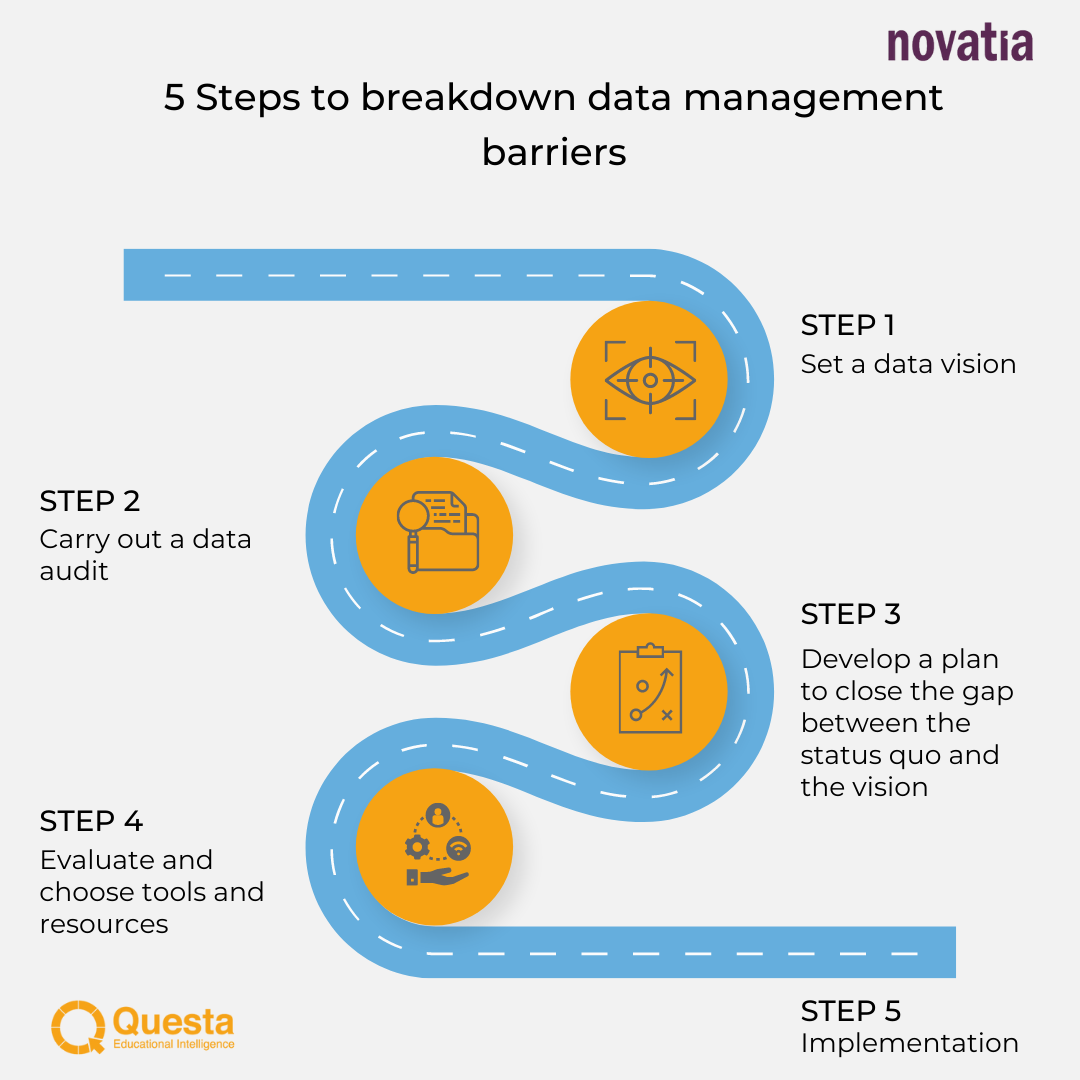
 There are four key steps that MAT leaders can take to break down these barriers:
 To find out more about these barriers and how to break them down, read our data management guide.
Let’s focus on the last step, deciding which tools/resources you need to implement your data management plan.
Tools to facilitate Data Management
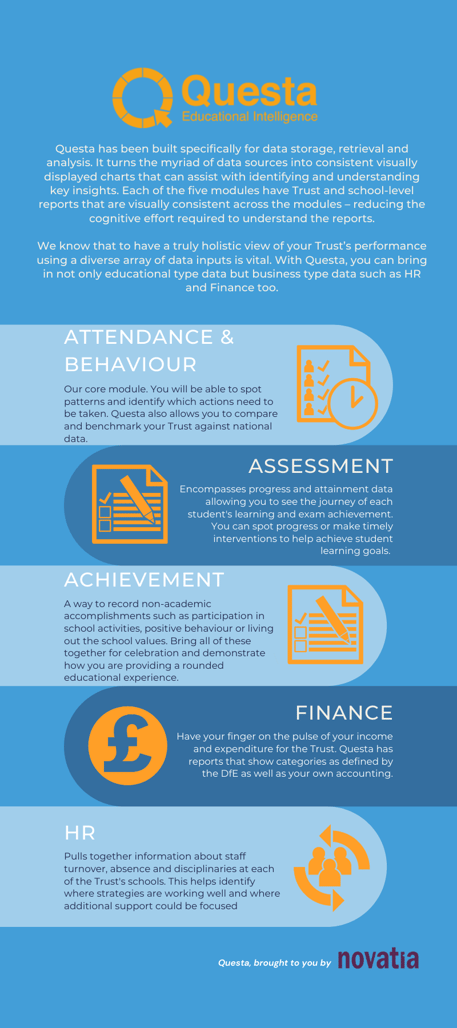
As ICT specialists in Education, we have seen many MATs and schools struggle with their Data Management, their ability to make data-driven decisions and how it can have a detrimental impact on performance. As a result, we developed Questa, which is a Data Warehouse and Educational Intelligence solution for MATs and Schools.
Questa draws from multiple data sources into the Data Warehouse as well as providing a single view from individual school to Trust level. It has one core module of Attendance and Behaviour and four add on modules, Assessment, Achievement, Finance and HR.
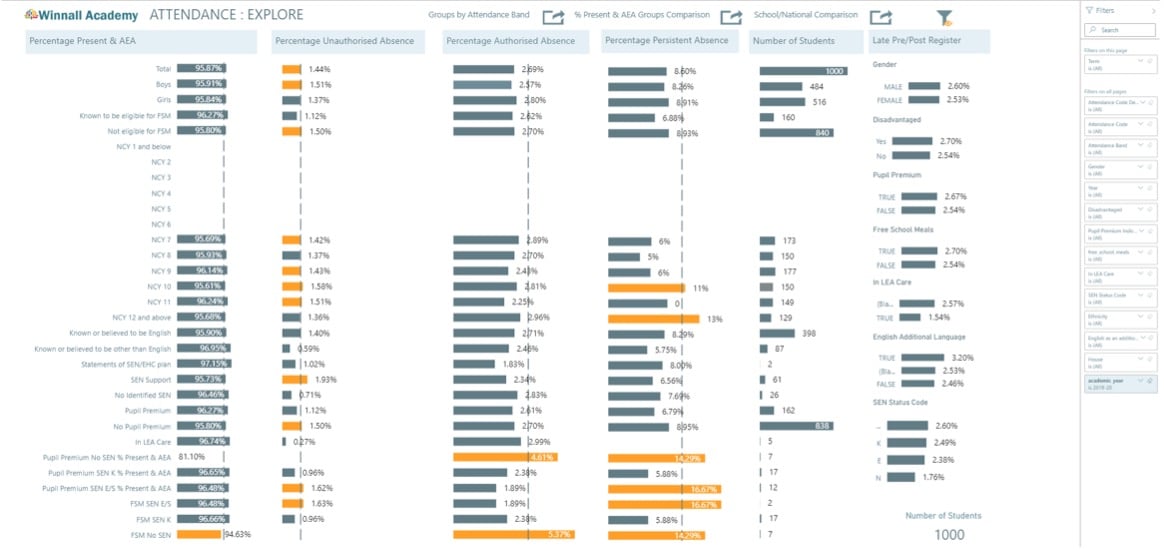
Furthermore, the easy-to-understand dashboards, which are at Trust, school and student level, enable Trusts and schools to monitor progress against Key Performance Indicators. We call this Trust level dashboard the Q-View. Here you will be able to answer many questions you have such as the one raised at the start of this blog - how do you gain the oversight that breaks down the barriers of different age phases and terminologies? This is achieved by bringing national age-related expectations into the dashboard to provide a common language across age phases. Resulting in Trust leaders being able to draw comparisons between schools despite the difference in the contexts.
How can I bring data together to see strategic Trust-wide performance?
The Q-View concept provides an overarching layer of dashboards which combine data from the underlying domains. This could be Trust-wide, then stratified to school and student level.
This combination could happen in two different ways:
- Bring together charts from different data domains into a single dashboard/report view.
- Perform calculations, e.g. ratios using variables in the different data domains.
Each Q-View has its own decision audience and role with the function of reporting:
- a range of national resource management indicators for a Trust Board.
- a range of national financial value indicators for a Trust Board.
- against a range of objectives for the Trust’s strategic plan (e.g. a Balanced Scorecard)
- against specific research hypotheses or improvement interventions.
Which metrics will reduce uncertainty for my most important decisions?
Not all information is equally valuable. The best information reduces uncertainty enough to produce a decision with a desirable outcome. But not all data is collected with this purpose in mind and a lot of data is waste. Even nationally mandated indicators/metrics/KPIs serve a different purpose, and some could even drive unintended system behaviour.
The Questa team want decision makers in MATs to have the information they need for their specific priorities.
We’ve introduced the concept of Q-Scores to help with this challenge. A Q-Score is a performance measure which has been specifically designed for the Questa user community. It is a reliable benchmark that draws on the wide experience of the Questa community, and which can be tailored to your own Trust’s ambitions. Overall, the data is displayed in a way that is positively adding to the rich set of Trust-wide strategic measures.

How do I know my interpretation of the data can be trusted?
A lot of data interpretation relies too heavily on the comparison of individual numbers. This may compare one group with another, rank items in a list, compare this month to last month or to a target. Some of this practice has a financial legacy, where counting more or less money is an end in itself. Comparing two numbers can certainly tell us that they are different, but it can’t tell us whether the process which produced them has actually changed.
For strategy execution and continuous improvement, we must understand whether our system of processes is truly changing or whether the numbers are just natural variation. Questa’s analysis pages provide insight into relationships. The relationships shown by the regression lines gives a level of insight and trust in the data. In this example which is from the assessment module, it shows the impact of attendance and behaviour on predicted/target grade comparisons.
Randomness is everywhere. But patterns can emerge from a range of causes, which can be identified with appropriate analysis tools. Box charts provide a visual summary of the data enabling you, as a leader, to identify where the data might be skewed towards a particular pupil group, where the data is under tight control, or where there is a large amount of variation in the data. These types of charts bring about a degree of statistical analysis to understanding the data and can be used to pinpoint a shift in results when a change, even a small one, is implemented.
All of this means that Questa provides you with a single version of the truth giving you confidence in the validity of data and its interpretation, which can reduce ineffective interventions and knee-jerk tampering.
Conclusion
Making sense of the abundance of data available to MAT leaders is key to decision making and strategic management of the Trust. Using a common language that compares how well pupils are attaining when compared with their targets or age-related expectations, for example, overcomes the differences in approach used in different establishments across a MAT without imposing vanilla, one-size-fits-all assessment methods. Undertake the four key steps to break down the barriers to effective data management and you will be in a much stronger data position.
Selecting the right tools and resources is fundamental. The tools should display the data into clear dashboards for MAT leaders to make informed decisions. Questa, and its dashboards with Q-Scores and the Q-View, is an Educational Intelligence Solution that will make sense of the data and lead to improved strategic decision making and continued Trust performance.
For more info on Questa read our Questa product sheet or book a free demonstration.

![]()
Visit: www.novatia.com Email: info@novatia.com Call: 01962 832632