
MATs and schools have a plethora of data, so much, that it is sometimes difficult to make sense of it so that as a MAT leader you can be confident in your decision making to improve pupil, school and Trust performance.
Like many Trusts you may have an ambition to be more ‘data-driven’. But not all data is equally valuable. You decide to use dashboards to help you make sense of your vast amounts of data. Using a lot of data to build a multitude of dashboards doesn’t necessarily lead to better decisions. Information dashboards and reports will have more value if they are decision-driven rather than data-driven and therefore presents important messages clearly.
How can I make sense of the important information on a dashboard?
It is surprisingly easy to design charts and dashboards which unintentionally hamper human visual cognition. Many dashboards are not only aesthetically ugly, the choice of charts and their formatting can obscure important messages. This, therefore, can have a detrimental effect on making the right informed decision and consequently impacts learning outcomes.
The field of data visualisation helps us to understand how to apply human visual perception so that information is consumed rapidly and reliably. Good dashboard design should feel effortless compared with the frustration of hunting all over a screen to find its meaning.
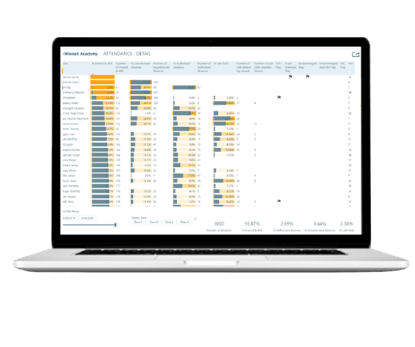
Questa, a Data Warehouse and analytics tool, is already unique in the way it aggregates data for Multi-Academy Trusts (MATs). It creates an overarching Trust-level view as well comparisons amongst member schools. Questa’s design focusses on building a better decision experience for users as well as introducing new visual design and analytical rigour.
Following best practice design principles in a number of ways is key in being able to build that better decision experience:
-
Layout – For cognitive ease, it is important that information can be found easily. Removing superfluous boxes, shading, images, over labelling of charts etc helps our brains to process what we are seeing and make sense of it. Using design best practice, you can have a consistent approach across all reports.
-
Colour – It has been found that a ‘traffic light’ approach, with intense reds, oranges and greens distract and obscure visual attention. Red, Amber, Green (RAG) schemes are often also driven by arbitrary thresholds and in addition it isn’t suitable for the colour blind. Using a single ‘pop-out’ highlight colour is a good technique for drawing the reader’s attention to important messages and exceptions.
-
Charts – Processing different chart types can take time and cognitive effort, and so adopting a core set of chart types so that the consumption of these is familiar each time they are encountered helps with mental processing.
Keen to help MAT leaders to make informed and confident decisions, Questa's dashboards follow the above design principals. The dashboards combine data from varying sources and are cognitively easy to read and therefore add value to the Trust by facilitating leaders to truly make insight, data-driven decisions.
Look out for subsequent blogs which will explore further the Questa design principals and how Questa can help you bring your data into a Data Warehouse and put you on the journey to making data-driven decisions that improves the overall performance of your Trust.
If you’d like to find out more about Questa and see how it can work for you and your Trust, then book a free demo with one of our Questa experts.

Alternatively, if you would like to have a chat about Questa and your Trust, please email us on info@novatia.com or call the team 01962 832632
Watch the Webinar

Like to learn more? Jan Harrison has recorded a FREE webinar ''Data Warehouse – how it can help your MAT function smarter." For further details and the recording click here.
Let us help you ...
Alternatively, if you would like further help and would like to speak directly to us, get in touch either by phone on 01962 832632 or by email on info@myquesta.co.uk. We’d be happy to help.

Visit: www.novatia.com/home-questa Email: info@myquesta.co.uk Call: 01962 832632